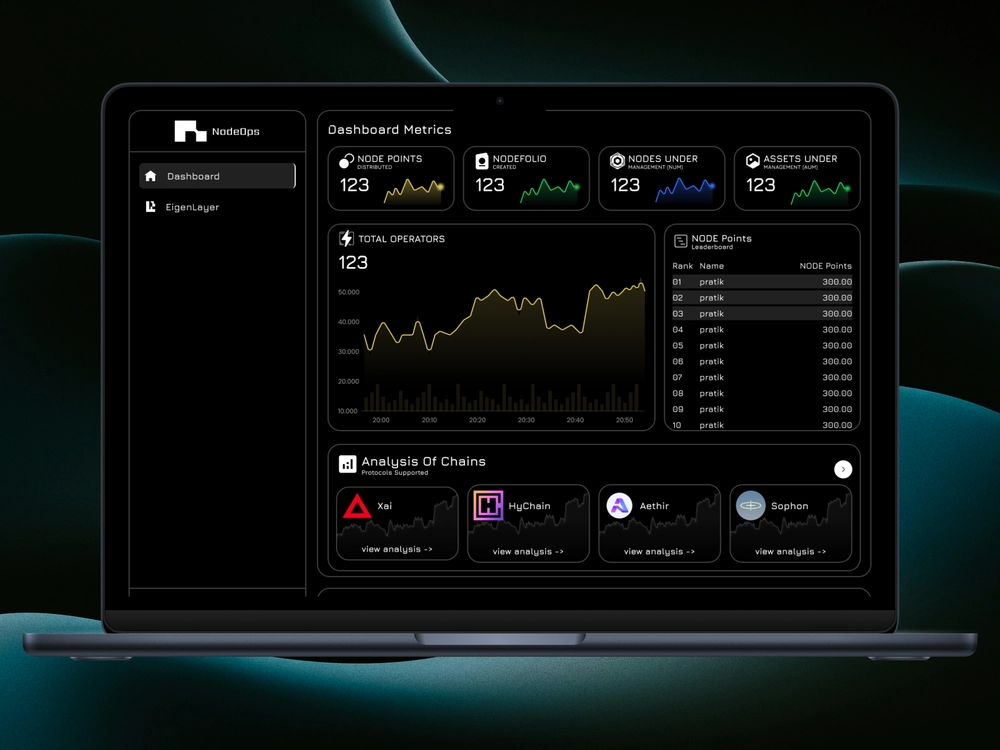
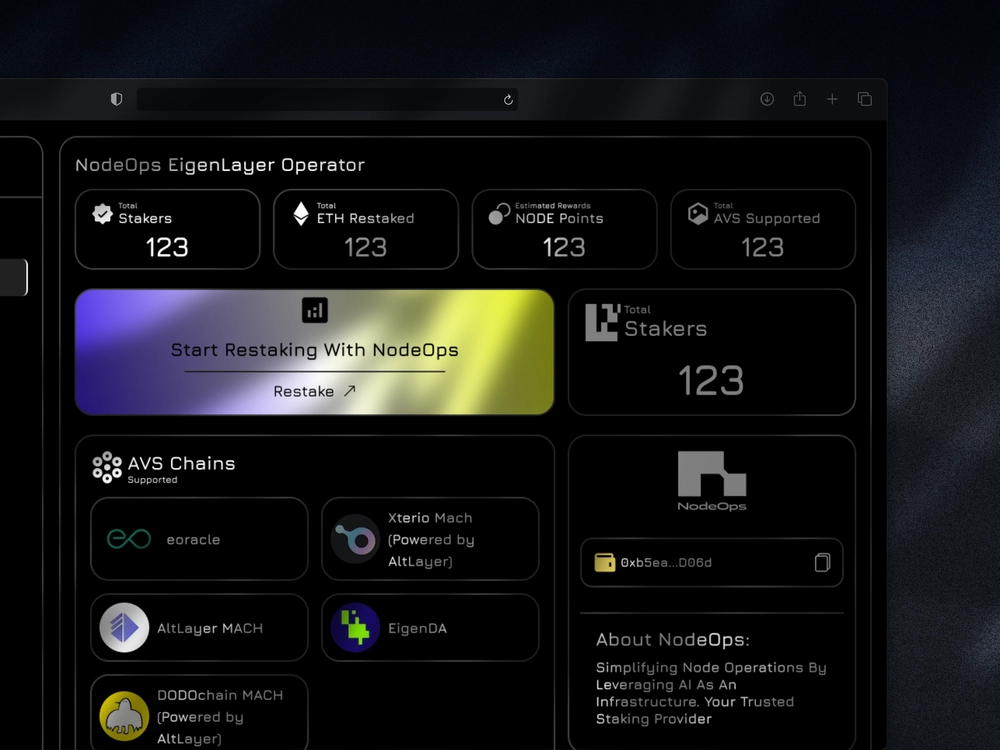
Stats - NodeOps
Designed and developed the full NodeOps dashboard UI from scratch - featuring platform-wide statistics, growth metrics, chain insights with per-chain detail views, and a dedicated EigenLayer stats section. The modern, rich interface — alongside the landing page — played a key role in helping NodeOps secure their $5M seed round.
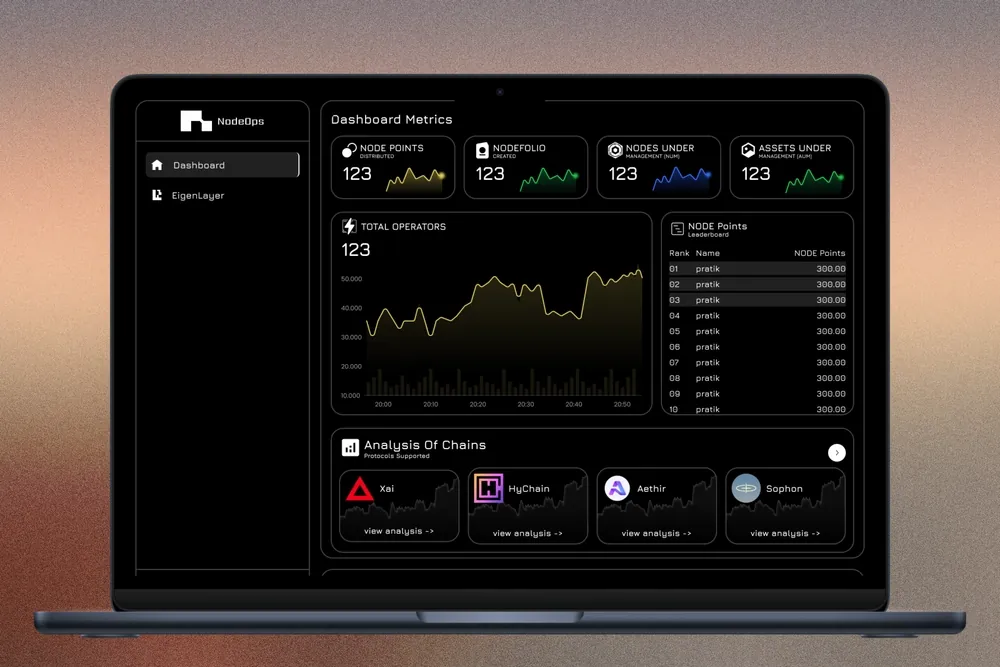
Building a data-dense operational dashboard that surfaces platform stats, multi-chain metrics, growth trends, and EigenLayer data — all without overwhelming users. Each chain needed its own detail view with granular stats, and the entire UI had to be polished enough to support a $5M fundraise.
Designed a card-based, visually rich dashboard with three tiers of depth: high-level platform KPIs, per-chain breakdowns with expandable detail views, and a dedicated EigenLayer analytics section. Built the landing page and full UI single-handedly, delivering a cohesive, investor-ready product that communicated scale and professionalism.